Here, detailed reports on students' academic performance are generated. These reports provide a comprehensive view of their performance in different areas and activities.
 |
|
 |
Each report presents information averaged by student, by learning area, as well as specific course reports, including diagnostic and practice tests.
To get each report, you need to:
- Select a time period.
- Click on <Generate>
Description of each report:
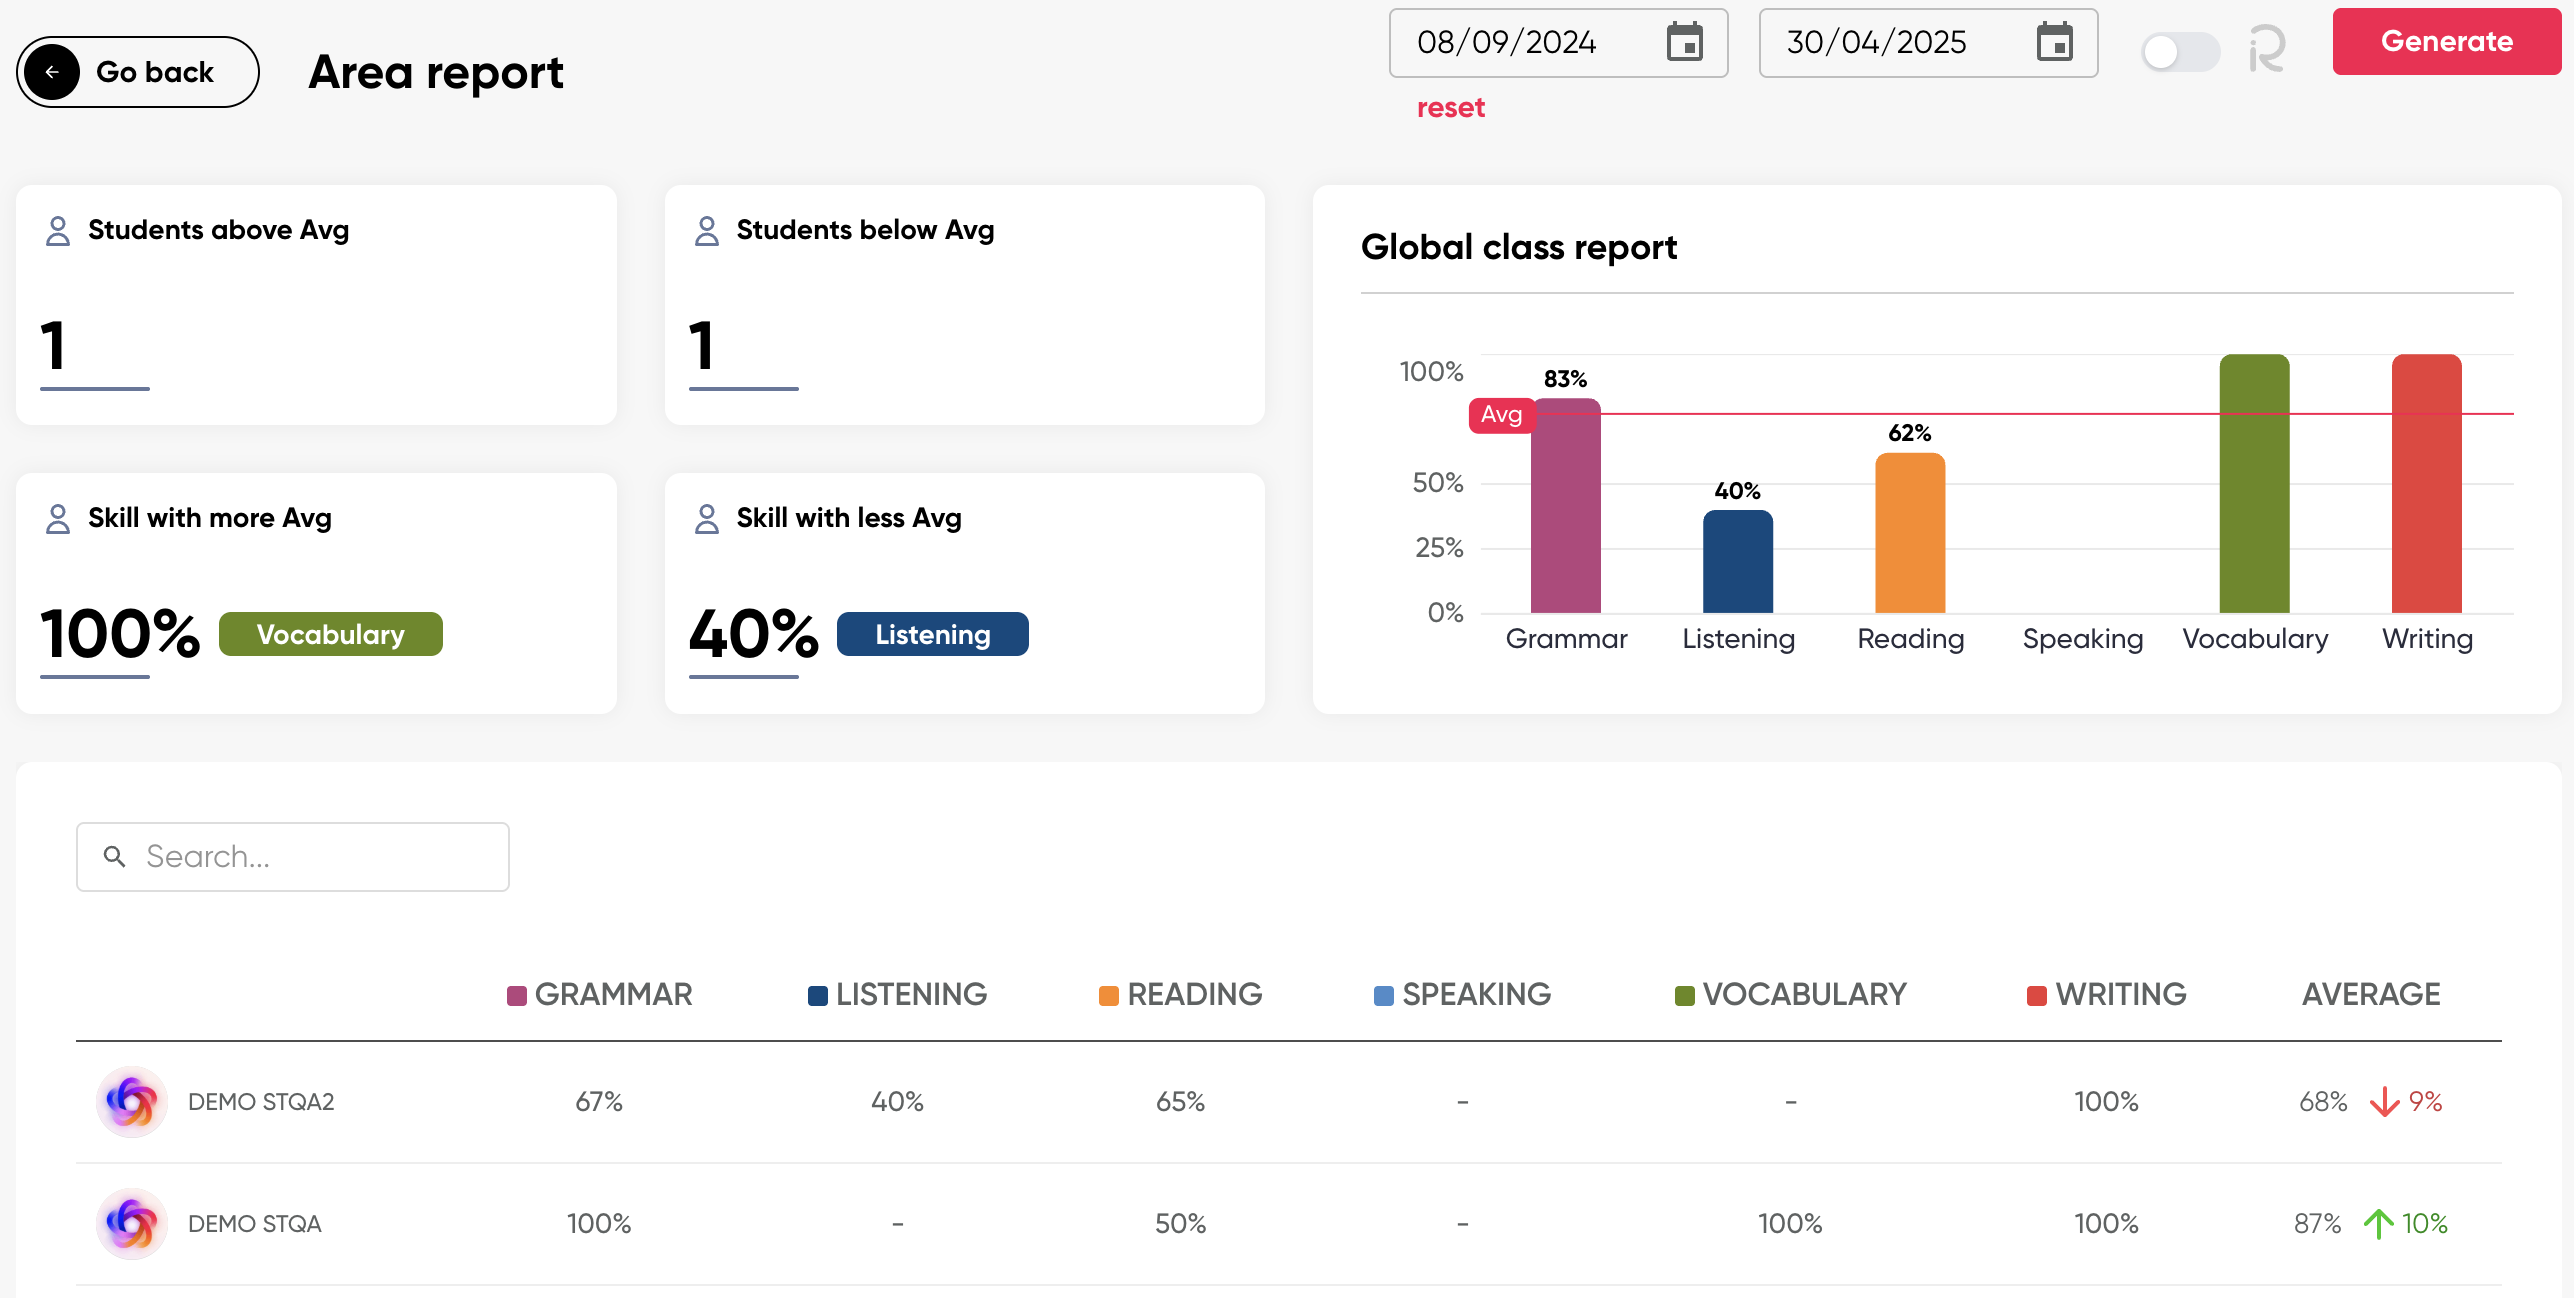
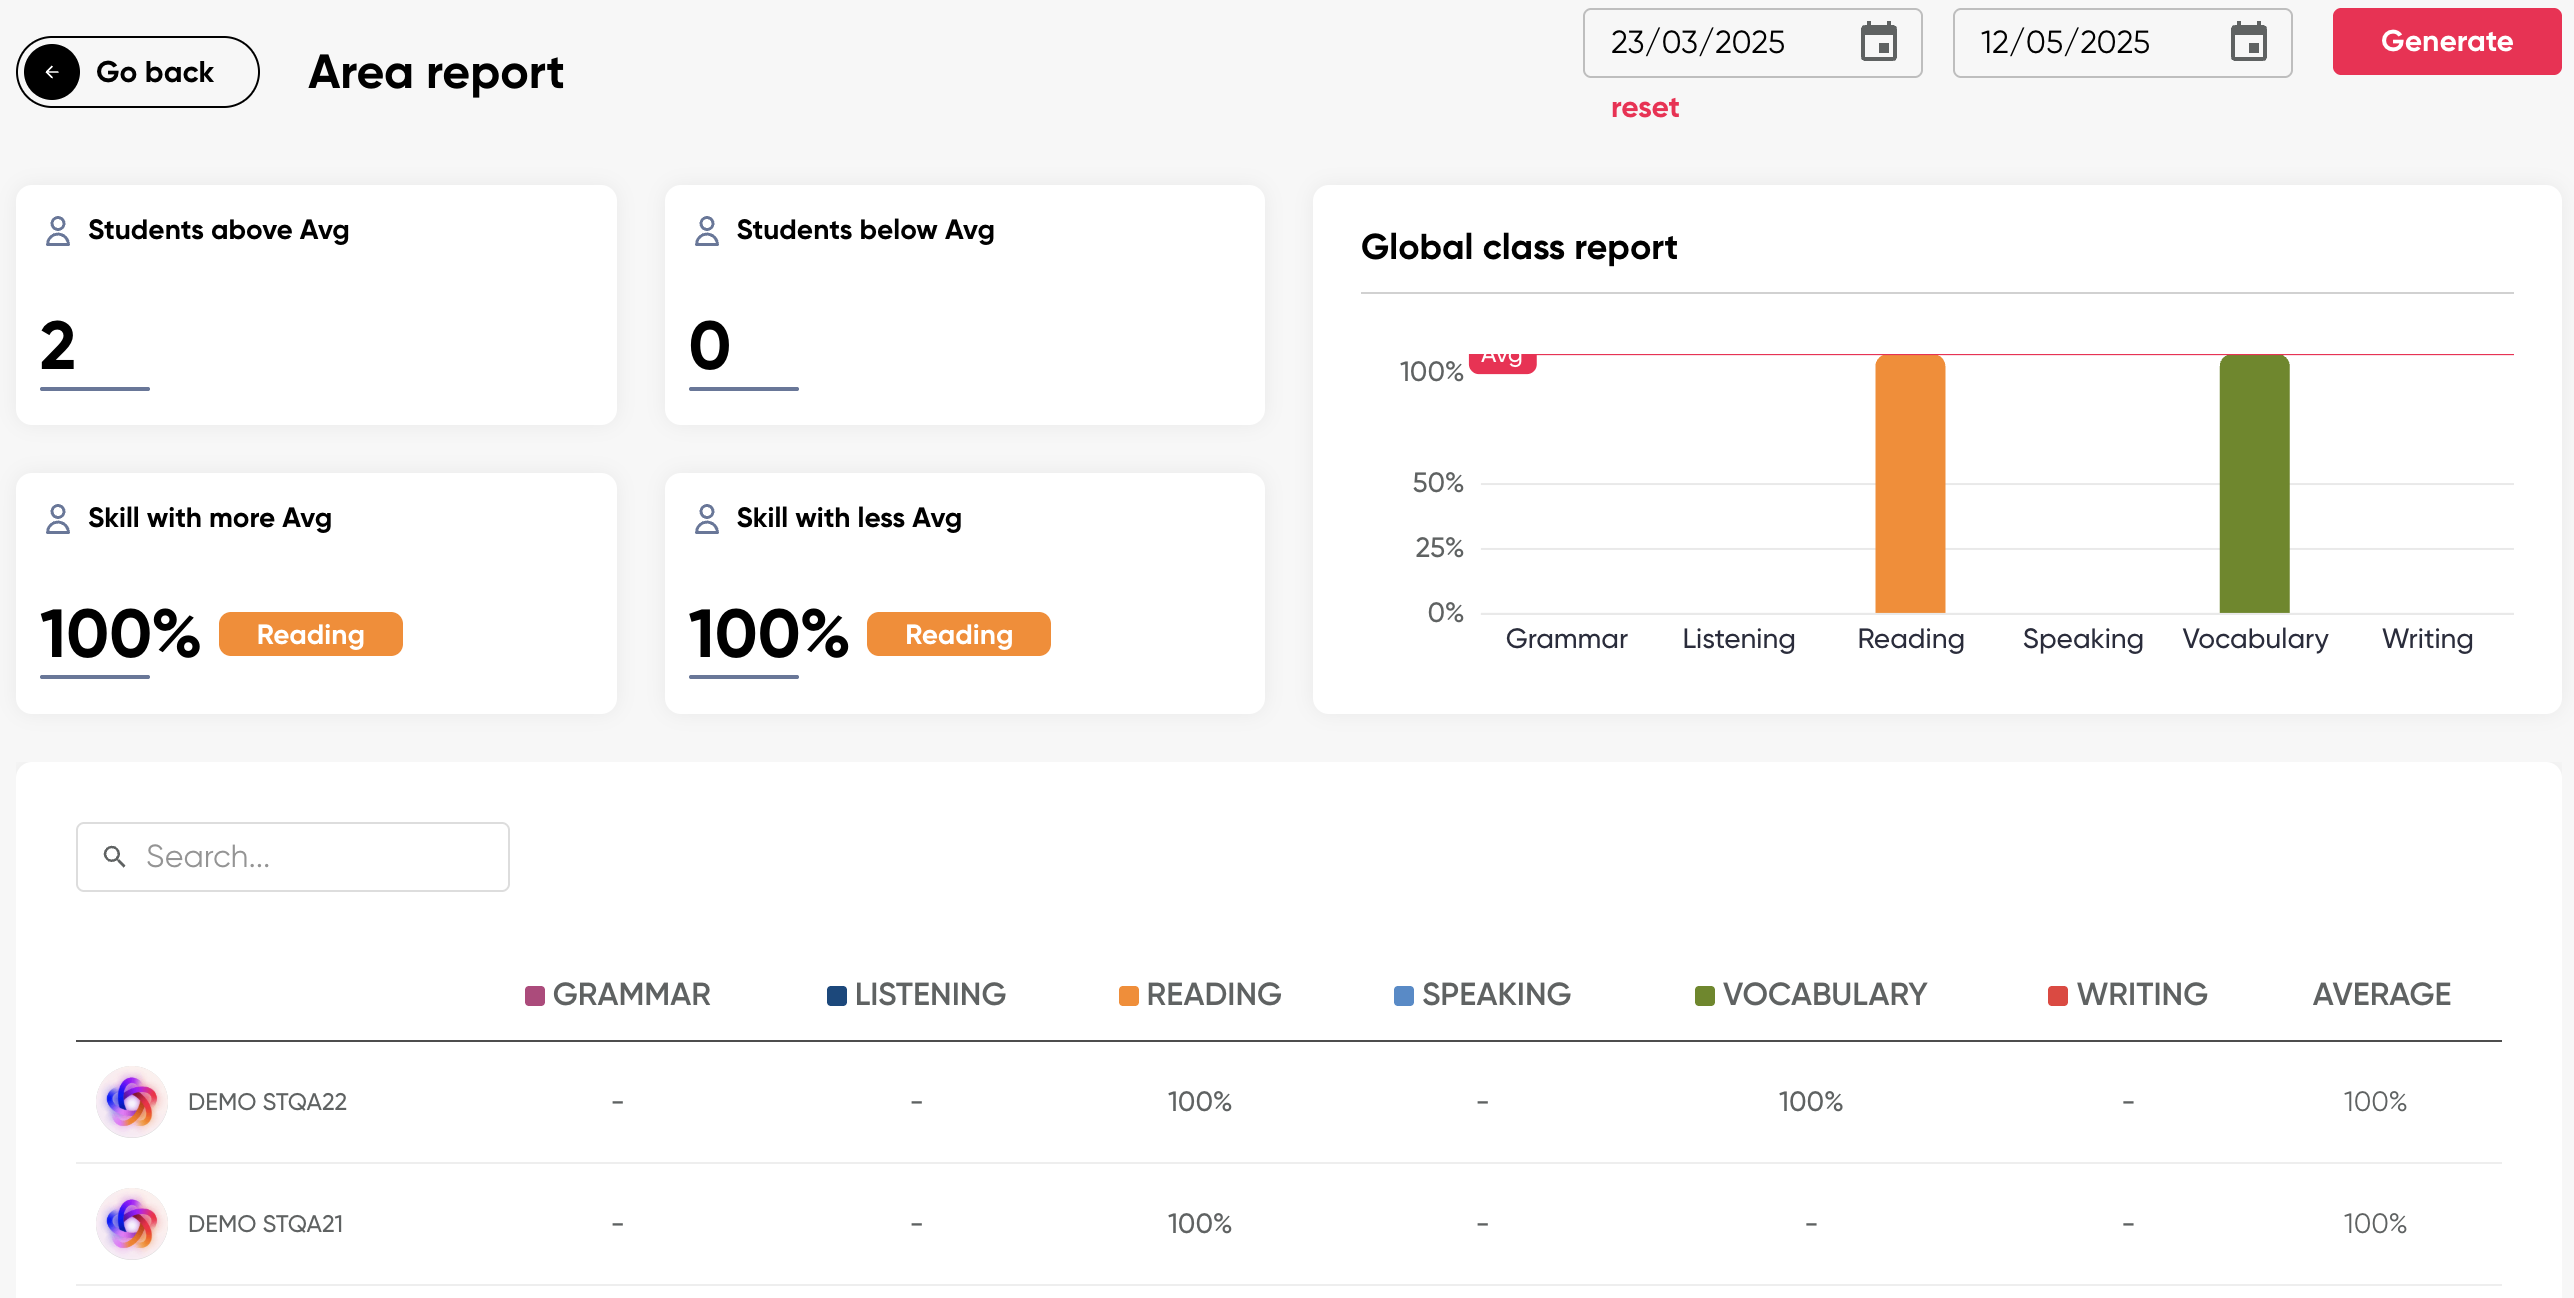
Area Report: This report displays charts showing the overall average score obtained by students, both collectively and individually, including the percentages for all skills.
The Area Report shows the percentage obtained for the Learning Objectives (LOs) assigned by the teacher and the activities completed through self-study, as well as a quick overview of the highest and lowest scoring skills across all students, and the total number of students performing above or below the class average.
The chart displays the class average, highlighted with a red line, along with the percentage obtained by the class in each of the skills (grammar, listening, reading, speaking, vocabulary, and writing).
The student list shows the percentage achieved in each skill by individual students, as well as their overall average. If a student's average is above the class average, an upward green arrow is shown; if it is below, a downward red arrow is displayed.
 View Area Report
iRead Area Report: Displays the average performance in the corresponding iRead skills.
It allows teachers to view student performance across the different iRead skill areas. It provides both an overall and a detailed view of student progress.
The iRead Area Report shows the percentage obtained for the iRead Learning Objectives (LOs) assigned by the teacher and the activities completed through self-study, as well as a quick view of the highest and lowest scoring skills across all students, and the total number of students performing above or below the class average.
The chart displays the class average highlighted with a red line along with the percentage achieved by the class in each skill area (grammar, listening, reading, speaking, vocabulary, and writing).
The student list shows the percentage obtained in each skill by every student, along with their individual average. If a student's average is above the overall class average, an upward green arrow is shown; if it is below, a downward red arrow is displayed.
 View iRead Area Report
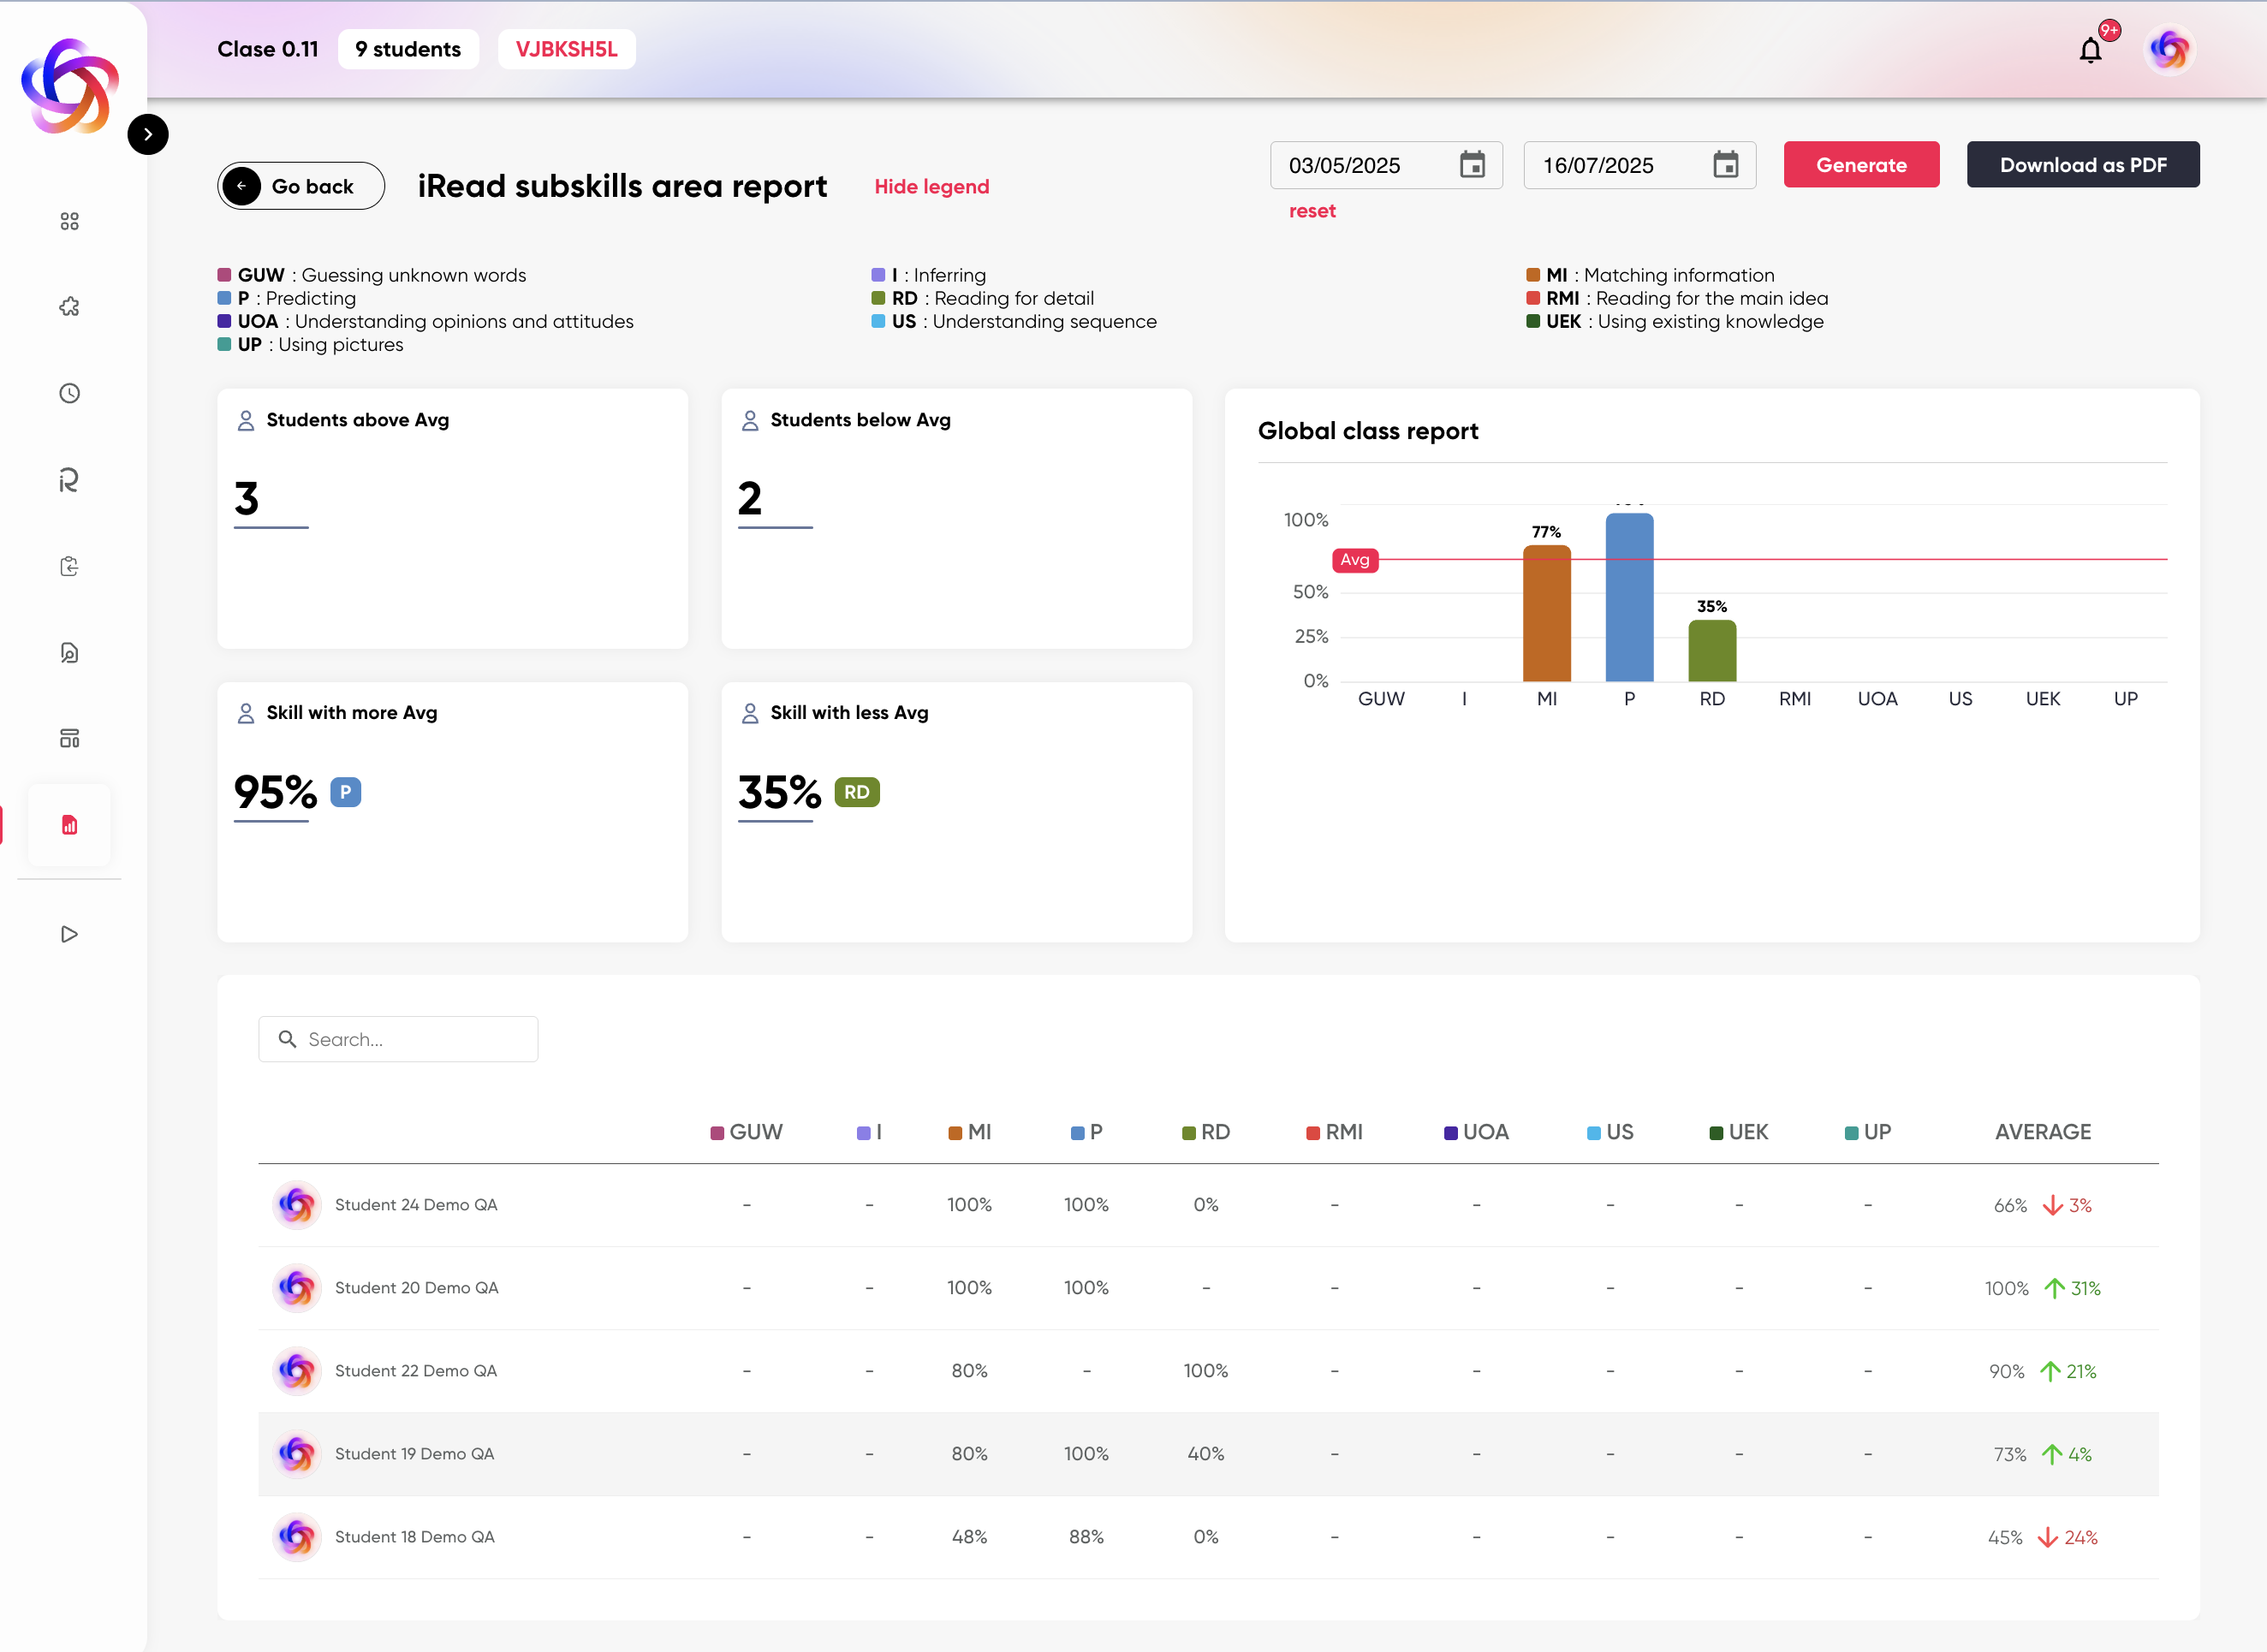
iRead Subskills Area Report: Shows the overall average obtained by students collectively and individually for the iRead subskills.
The iRead Subskills Area Report It is a visual report that shows students' performance in specific subskills related to reading comprehension.
The chart shows us:
- Students above Avg / below Avg: Number of students who are above or below the overall class average.
- Skill with more Avg: Subskill with the highest average performance.
- Skill with less Avg: Subskill with the lowest average performance.
- Global class report: Bar graph showing the average performance percentage for each subskill at the group level.
- Student table: Displays individual results for each student in each subskill, along with their average and a visual indicator (green or red arrow) showing whether they are above or below the overall average.
Assessed subskills:
- GUW: Guessing unknown words
- I: Inferring
- P: Predicting
- UOA: Understanding opinions and attitudes
- UP: Using pictures
- MI: Matching information
- RD: Reading for detail
- RMI: Reading for the main idea
- US: Understanding sequence
- UEK: Using existing knowledge
At the top, you can select a date range to generate the report for a specific time period and you also have the option to download it as a PDF.
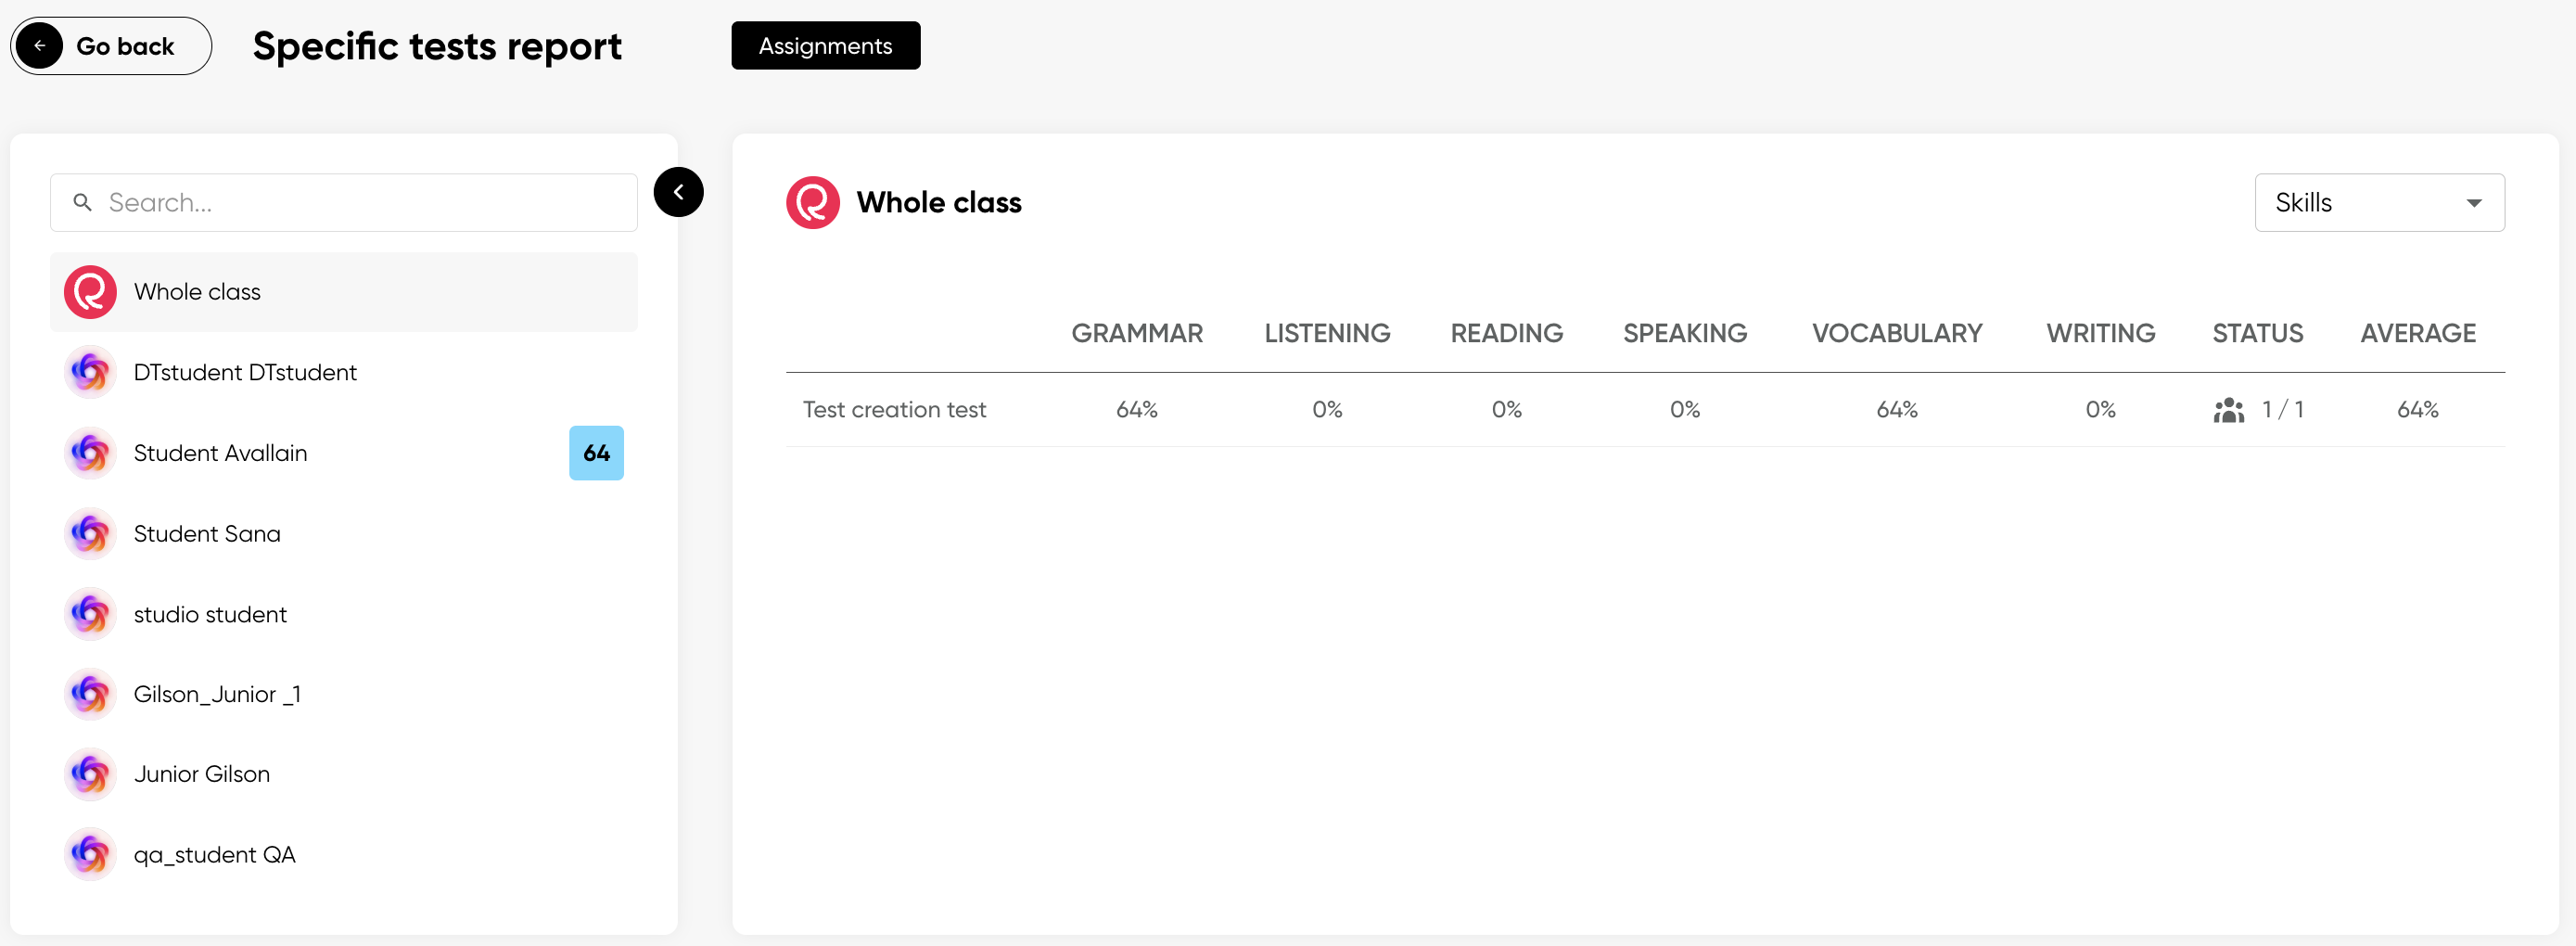
Specific Test: Displays the average overall results per class for the Subject Tests, as well as the percentage obtained by each student.
The Specific Test Report is a detailed report that provides specific information about students’ performance. It includes:
- Grammar
- Listening
- Reading
- Speaking
- Vocabulary
- Writing
- Status
- Average
A list of students is displayed, and by clicking on each name, you can view individual results. Alternatively, select <Whole class> to obtain the overall results for the entire class.
 View Specific Tests Report
Note: The average shown corresponds to the average of the activity, not the sum of percentages per skill.
Additionally, the report view allows you to filter the assessed skills to review them individually or together, depending on your specific review needs. This provides a detailed and organized overview of students' performance in each of the evaluated competencies.
 View Skills Filter
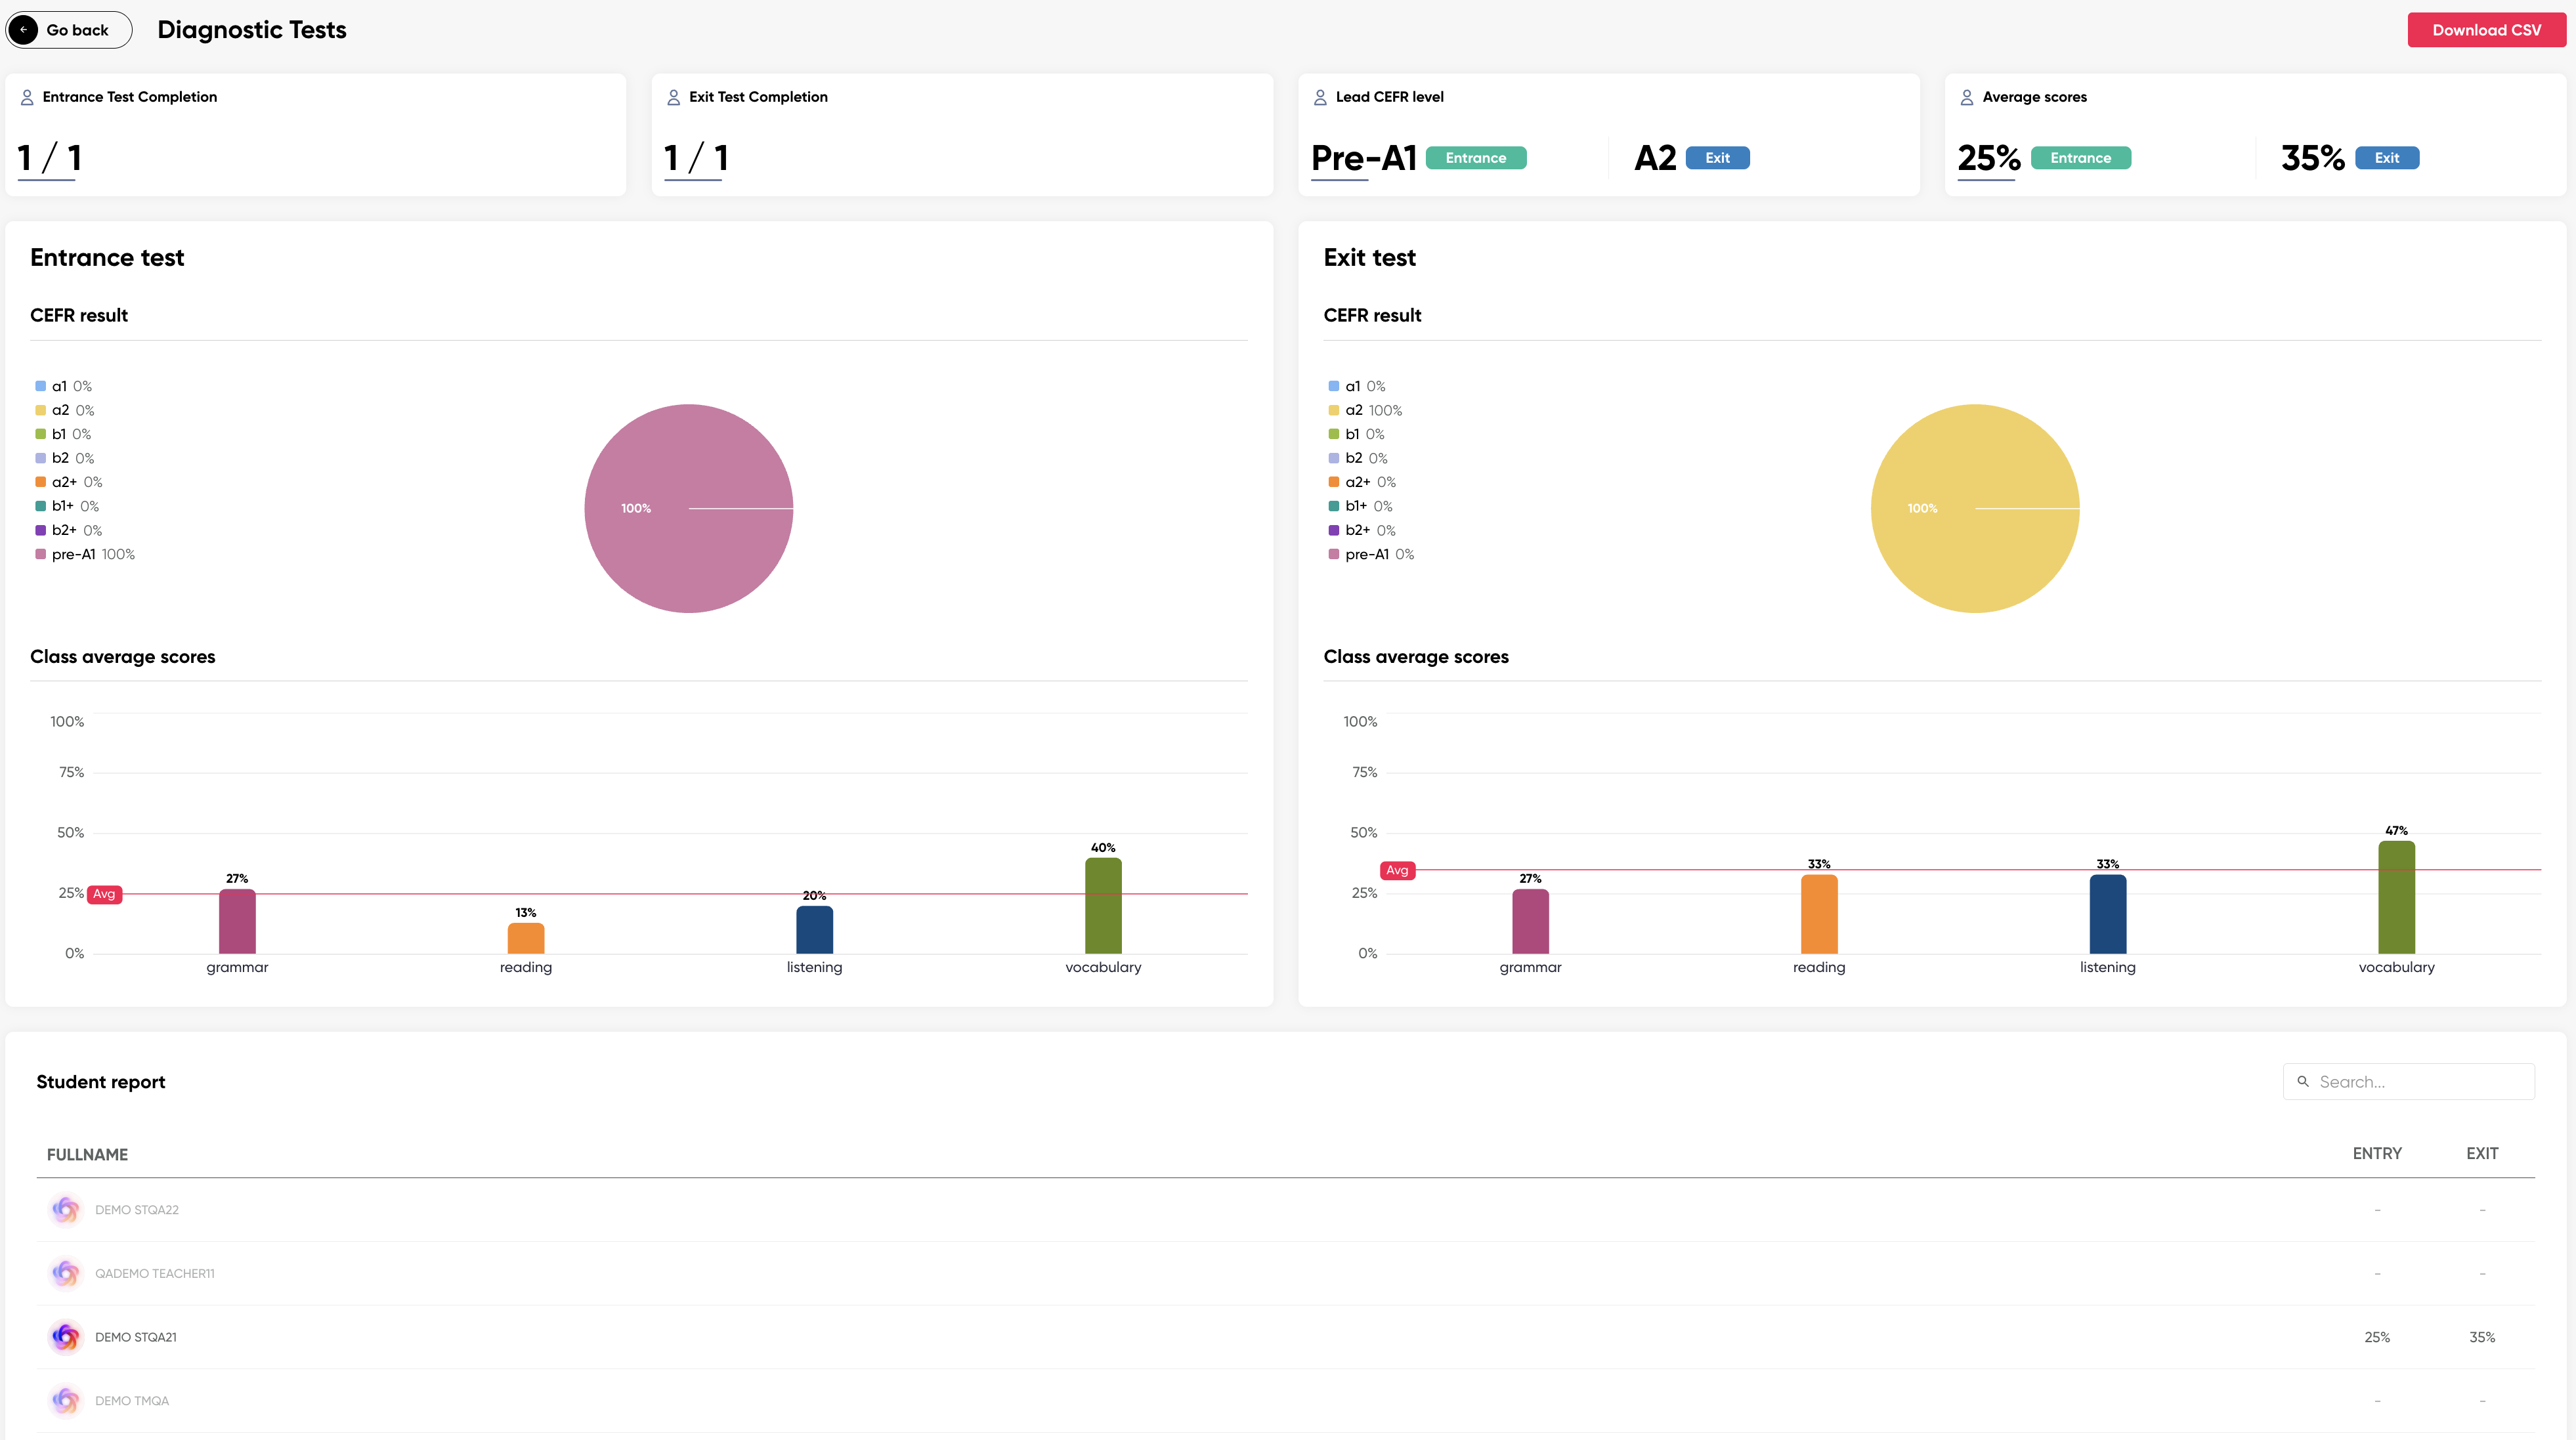
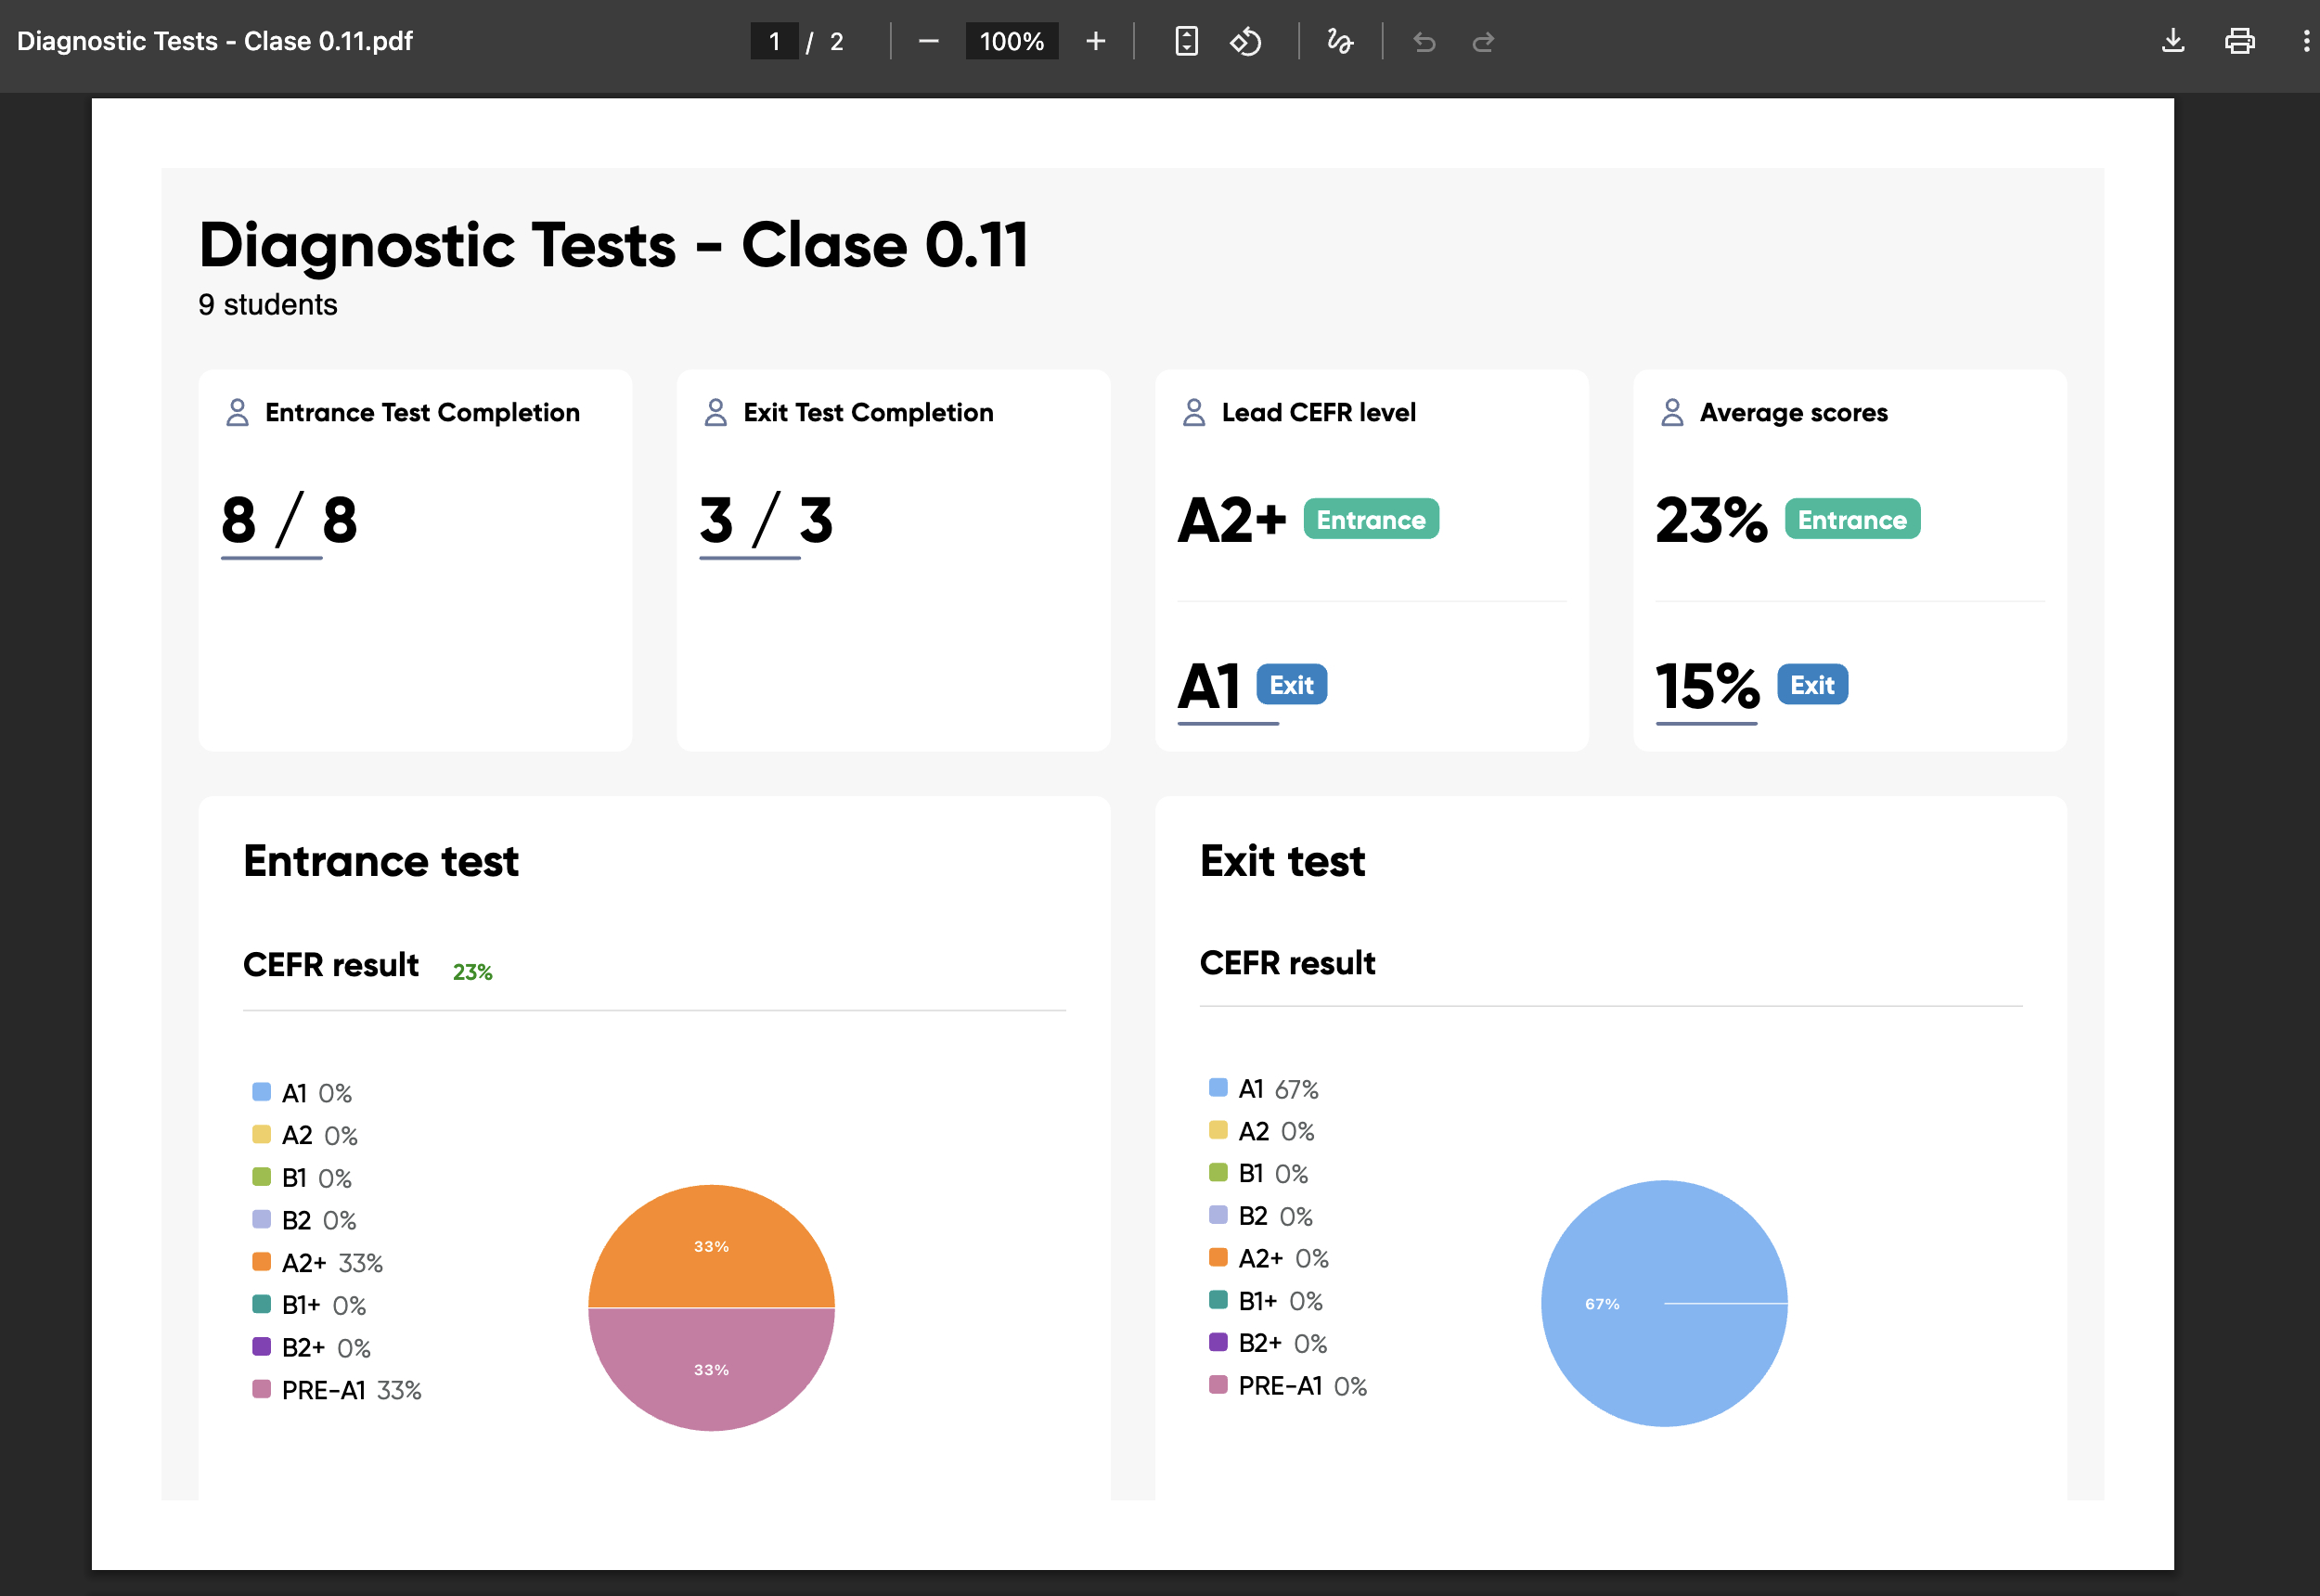
The Diagnostic Test Report provides information on the scores obtained in the initial and final diagnostic test. This helps determine the students' level at the beginning of the English course (entrance Test) and allows for a comparison with the level reached at the end of the course (Exit Test).
The report shows the level achieved by students based on the Common European Framework of Reference for Languages (CEFR).
CEFR Levels:
- Pre-A1 (Pre-beginner)
- A1 (Beginner)
- A2 (Elementary)
- A2+ (High elementary)
- B1 (Intermediate)
- B2 (Upper intermediate)
- B2+ (High upper intermediate)
Additionally, the report displays a comparison between the levels obtained in the entrance and exit tests, as well as the initial and final percentage scores.
The chart indicates the overall average percentage per skill (grammar, reading, listening, and vocabulary) for the students using a red line, and details the percentage achieved per skill by the entire group.
The student list displays each student's initial and final score.
 View Diagnostic Test
To download the report, click on <Download CSV> to get the information in Excel format, or click on <Download PDF> to obtain the information in PDF.
 View CSV format
 View PDF format
The <Reset> option resets the date range to the one used to generate the report.
